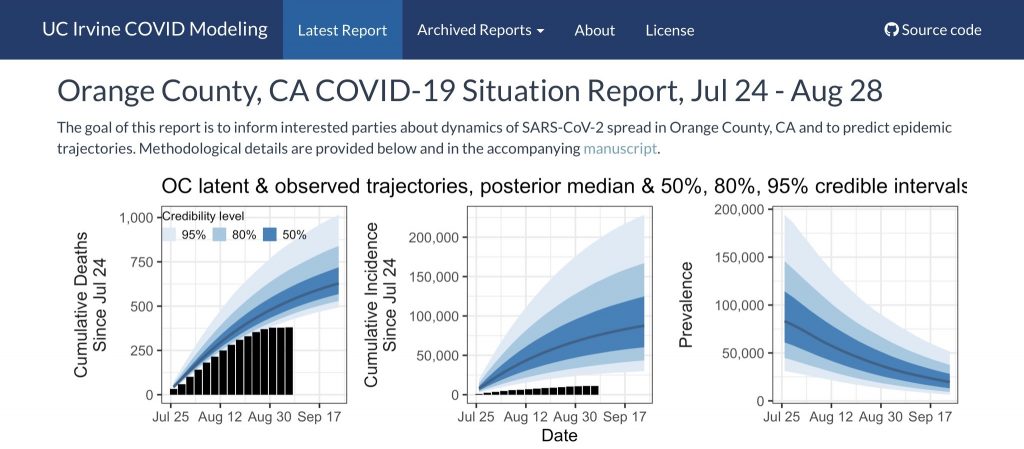
A new website reports on the spread of COVID-19 in Orange County and forecasts future trends.
A months-long collaboration among UCI, the National Institute of Allergy and Infectious Diseases (NIAID), and the Orange County Health Care Agency (OCHCA) has resulted in a new portal that reports on the spread of COVID-19 in Orange County and forecasts future trends.
“We call it the OC COVID Situation Report,” says Vladimir Minin, a professor of statistics in the Donald Bren School of Information and Computer Sciences (ICS) and the associate director of the UCI Infectious Disease Science Initiative. “OCHCA collaborators provide us with frequently updated, detailed COVID-19 surveillance data and help us navigate this data. Our modeling team, which consists of UCI and NIAID researchers, feeds this data into our coronavirus transmission model and compiles results into an updated situation report.”
These reports, which will be regularly updated and archived on the portal, include estimates of how many coronavirus infections actually occurred, rather than the number of infections reported; how many infectious individuals OC has on any given day; and how quickly the virus is spreading. The researchers also produce short-term forecasts of deaths due to COVID-19 and fractions of positive tests among all performed COVID-19 diagnostic tests. The portal purposefully does not use the most recent data, because a 10-day lag helps account for reporting delays. Note that the data excludes repeat tests, so patients tested multiple times (such as while in the hospital) will not skew the data.
The current “situation report” covers July 24 – Aug. 28. It shows that the effective reproduction number — an important indicator that measures the rate at which infections are growing or declining — is currently below 1, which means that Orange County is successfully suppressing coronavirus spread. However, OC residents need to remain vigilant, because even though the number of infectious individuals is declining in Orange County, the model predicts that the number of infectious individuals on any given day will remain in the tens of thousands through mid-September.

The authors of the report use a Bayesian modeling framework to integrate both cases and mortality data. The modeling framework accounts for variability in the number of diagnostic tests across time, so an increase in testing is not mistakenly interpreted as an increase in the number of infections. Technical details and a retrospective analysis of OC data from April to July are available in a new manuscript posted on arXiv.
The researchers hope their method and regularly updated reports will facilitate data-driven decision making in Orange County. “The main target audience is public health officials and policymakers,” says Minin, “but we are trying to make the reports easy to understand for the general public as well.”
The model and OC COVID Situation Report was developed by Minin; two UCI statistics Ph.D. students working with him, Damon Bayer and Isaac Goldstein; researchers from the National Institute of Allergy and Infectious Diseases — Jon Fintzi, Keith Lumbard and Emily Ricotta; and Orange County Health Care Agency collaborators Richard Chhuon, Alissa Dratch, and Matthew Zahn. The work was supported in part with funding from the National Institutes of Health and the UCI Infectious Disease Science Initiative.
The portal follows on the heels of another website Minin’s team and their collaborators helped create last month. “The focus of the already launched website is visualization of the county-level data. It offers an objective look at the observed data — no modeling there,” he explains. “The new portal takes it to the next logical level by using our statistical model for the virus spread, fitting this model to data, and producing parameter estimates and forecasts. The first portal gives you a look at what is known (data), while the second uses modeling and statistical analysis to peek into the unknown.”
— Shani Murray